


Introduction
Chloroquine (CQ) was the most frequently used first-line therapy for uncomplicated Plasmodium falciparum (P.f.) malaria from the 1940s through to the 2000s.1 As a result of its high efficacy, good safety profile, and low cost, CQ was a key part of the 1950s Global Malaria Eradication Program.2 However, factors including funding constraints, lack of political support, and the emergence and subsequent spread of resistance to CQ and the pesticides used in vector control hampered eradication plans.3 Resistance to CQ was first identified in the late 1950s, on the Thai–Cambodian border and concomitantly in South America.4–6 The spread of CQ resistance to Africa ensued, with treatment failures confirmed in 1978 in Kenya and Tanzania,7,8 and later reported in West Africa in the 1980s.9,10 Despite declining use, CQ remained the first-line therapy for uncomplicated P.f. malaria in the majority of sub-Saharan countries until after 2000. An increase in malaria morbidity and mortality in children < 5 years of age was observed during this period, and this trend has been attributed partly to CQ resistance.11,12
During the 1960s, sulphadoxine-pyrimethamine (SP) was introduced in many countries to replace CQ. Because of a rapid decline in efficacy in areas of intense use, first in Southeast Asia in the 1970s and later in East Africa in the late 1980s,13 SP was withdrawn from African countries as a first-line treatment of P.f. malaria between 2003 and 2008. SP continues to be recommended as an intermittent preventative treatment of pregnant women14 and more recently as part of the seasonal malaria chemoprevention in areas of highly seasonal transmission.15
Over the past decade African countries have transitioned from CQ or SP to artemisinin-based combination therapies (ACTs) as a first-line policy for uncomplicated malaria. The transition from CQ took place in most African countries in the late 1990s and 2000s (Figure 1). Malawi was the first African country to change its policy from CQ to SP in 1993. South Africa was the first country to recommend an ACT in 2001, whereas Malawi and Botswana were the last to switch from SP in 2007 (see the animation http://www.wwarn.org/about-us/news/antimalarial-drug-treatment-policy-developments-africa illustrating temporal changes in national antimalarial policies in Africa from 1991 to 2011. Also see Figure 1 and Supplemental Table 1 in the extra web material).

Illustration of the timing of antimalarial policy changes in Africa (see Table S1 for more details). The first line policy duration of CQ, SP, ACT, CQ + SP and AQ + SP are shown in red, blue, green, black and light blue arrows, respectively. AQ denotes amodiaquine.
Citation: The American Society of Tropical Medicine and Hygiene 89, 5; 10.4269/ajtmh.13-0129
A reduction in drug pressure has been linked to the return of CQ susceptibility in several malaria-endemic countries,16 leading to suggestions that the complete removal of CQ may eventually lead to a return of susceptible parasite populations. However, CQ usage has continued for many years after the switch in national policies for the treatment of P.f. In particular, CQ is still commonly used to treat febrile illness in children, especially by those who seek treatment in the private sector.17 Because of the potential influence of this continued use of ineffective drugs on public health, a standardized approach for estimating drug use is needed. In this work, a methodology is proposed for using reports of actual drug use from publically available household surveys to estimate drug use trends and compare their magnitude in different countries. The primary aim of this work was to use the methodology developed to quantify the changes in common antimalarials, CQ and SP, both over time and post policy change. A secondary objective was to correlate measures of drug use and drug resistance.
Methods
Data extraction.
Drug use data collected between 1999 and 2011 in 40 African countries in Demographic Health Surveys (DHS)18 and Multiple Indicator Cluster Surveys (MICS)19 were included in the analysis. The DHS and MICS surveys included in this work contained malaria modules, which ask women within a household to report on antimalarial use in children under the age of five within their care, who have experienced fever symptoms in the past 2 weeks (see Figure S1 and S2 in the extra web material for extracts from the DHS and MICS surveys, respectively).
Quantitative information on antimalarial use, at the individual patient level, was extracted as follows:
- 1. Permission to use the data was obtained, data downloaded and converted to a format suitable for reading into R, version 2.12.2.
- 2. For each survey, an accompanying survey question text file was obtained. An automated text search in R allowed extraction of question codes and text related to antimalarial questions.
- 3. The question text from Step 2 was string matched to common antimalarials using a standardized coding system.
- 4. The data were loaded into R and individual data stored, according to the standardized names from Step 3. Where more than one question was asked about the same standardized drug code, the data were aggregated.
The DHS and MICS surveys use two-stage cluster sampling techniques in which census areas were selected with probability proportional to population size within the main sampling domain identified. Data were extracted at the individual level to ensure correct sample weighting in the analyses. When a survey was conducted over a period of 2 years, the starting year of the survey was used in the analysis.
National antimalarial policy information was obtained from the World Health Organization's Susceptibility of P.f. to Antimalarial Drugs Report on Global Monitoring 1996–2004, malaria country profiles 2011, World Malaria Reports 2005 and 2008, and supplemented by a literature search in PubMed.
Drug use aggregation.
Statistical model.
Time t, was measured either as the year of the survey (taken to be the number of years after 1999) or as years after the policy change from drug A. The model fitting was performed in R, version 2.12.2 and the mixed effects models were fitted using the lme4 package.
Correlation of drug use and parasite drug resistance.
When drugs are used intensively in a region or a country, selection of parasites resistant to those drugs is inevitable, especially when already resistant parasites have evolved in other regions and could spread to a new location. In this work, we take the reported drug use estimates as a measure of drug pressure and correlate these to well-characterized molecular markers for SP resistance. The relationship between SP use and the prevalence of those molecular markers in countries that recommended SP for various lengths of time was explored. A large database of the prevalence of molecular markers associated with resistance to SP has previously been created.20 The prevalence of the mutation dhps540E is indicative of high SP resistance21 and in other work, a spatiotemporal model was developed for the spread of the dhps540E marker in Africa.22 Outputs of this model allow estimation of the average dhps540E prevalence within a country in a given year. For details of the data used in the dhps540E model see WWARN's Molecular Surveyor (http://www.wwarn.org/resistance/surveyors/molecular).
Results
Data extraction.
Ninety-nine surveys from 40 African countries monitored antimalarial use in children between 1999 and 2011 (Supplemental Table 2). Sixty-one DHS surveys from 29 countries and 38 MICS surveys from 31 countries were included (Table 1). The MICS surveys were performed on average earlier than DHS surveys and therefore tended to report a higher level of CQ usage. Supplemental Table 1 summarizes the antimalarial policy changes for malaria endemic African countries.
Summary of Demographic Health Surveys (DHS) and Multiple Indicator Cluster Survey (MICS) data included in the analysis
| DHS | MICS | |
|---|---|---|
| Number of surveys | 61 | 38 |
| Median year | 2006 | 2001 |
| Average CQ use (%) | 15.7 | 35.9 |
| Average SP use (%) | 3.5 | 4.8 |
| Total number of children | 121,831 | 64,703 |
| Number of countries | 29 | 31 |
CQ.
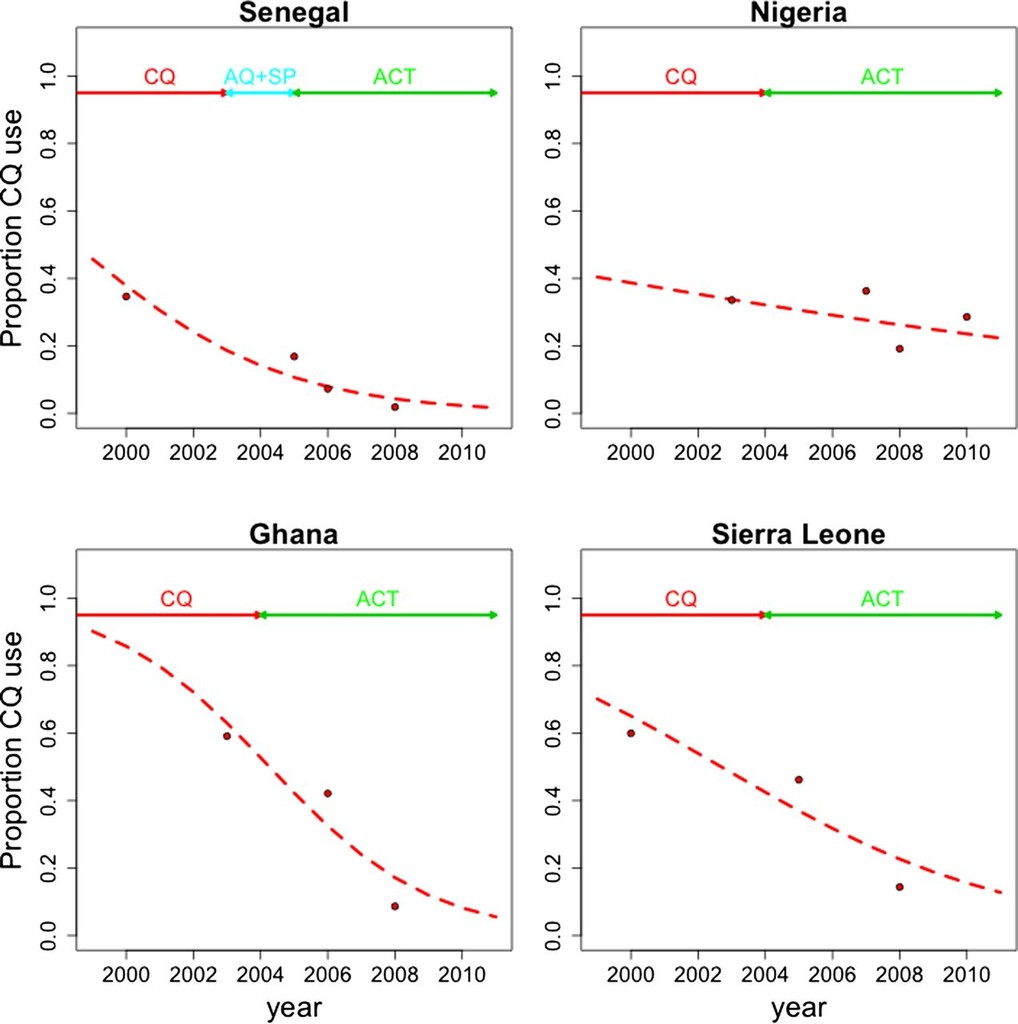
The time plot in Figure S3 shows the percentage usage of CQ in 94 surveys from 40 countries and shows the general decrease in use from 1999 to 2011. The mixed effects model was applied to estimate CQ use in African countries. Figure S4A and B show the country-level intercepts and slopes, respectively, where time was measured as years post 1999. Figure 2 shows the model predictions for CQ use in each country in 1999, 2005 and 2010. Figure 3 illustrates in detail the mixed effects model predictions for CQ use in four countries with different trends: Senegal (intermediate starting CQ use, fast rate of reduction), Nigeria (intermediate starting use, slow rate of reduction), Ghana (high starting use, fast reduction), and Sierra Leone (high initial use, slow reduction). The times at which drug policies changed are given at the top of each graph for ease of comparing with the trends.
Country level drug use estimates from mixed effects model of CQ use where time is measured as post 1999. CQ use is represented along the horizontal axis. The intercept (that is, CQ use in 1999) is represented by the black square for each country. The red lines show the change in CQ use from 1999 to 2005 for each country (indicated by the length of the red line). The green line shows the drug use change from 2005 to 2010 (indicated by the length of the green line). The model parameter estimates, standard errors and p-values are given in Table S3. Countries are ordered by increasing level of their CQ use in 1999 as reflected by their intercept in the mixed effects model.
Citation: The American Society of Tropical Medicine and Hygiene 89, 5; 10.4269/ajtmh.13-0129
Mixed effects model predictions (red dashed line) for CQ use in Senegal (top left), Nigeria (top right), Ghana (bottom left) and Sierra Leone (bottom right). The duration of first line policies for each country is indicated by the arrows across the top of each plot. The red dots represent the observed CQ use data.
Citation: The American Society of Tropical Medicine and Hygiene 89, 5; 10.4269/ajtmh.13-0129
To investigate the overall rate at which CQ use declined after policy change in Africa as a whole, a logistic regression model was fitted to the data from the 58 surveys that monitored CQ use, after it was no longer the first line drug (slope = −0.29, P < 0.001). At this rate of reduction, it would take 2.4 years for the odds of CQ use to fall by 50%.
The trend in CQ use, in each African country after CQ was no longer the first-line drug, was examined using a mixed effects model. The country-level intercepts and slopes for CQ use after policy change, from fitting the mixed effects model, are shown in Figure S5A and B. The intercept reflects the amount of CQ use at the time of policy change, and the countries are ordered on that basis. Ethiopia and Rwanda used the lowest proportion of CQ at the time of policy change and Ghana and Liberia, the highest. Figure 4 visualizes the changing CQ use post policy change in each country, showing the predicted use in the year of policy change, 5 years and 10 years after the policy change. The spatial trend of CQ use reduction in African countries post policy change is illustrated in Figure S6. There are countries in East and West Africa with slow and fast reduction of CQ use, i.e., there is no obvious spatial pattern in the reduction of CQ use.
Country level drug use estimates from mixed effects model of CQ use where time is measured as years post the year of policy change. CQ use is represented along the horizontal axis. The intercept (that is, CQ use in the year of policy change) is represented by the black square for each country. The red lines show the change in CQ use five years post policy change for each country (indicated by the length of the red line). The green line shows the drug use change from five years to ten years post policy change (indicated by the length of the green line). Table S4 gives the model parameter estimates, standard errors and p-values. Countries are ordered by increasing level of their CQ at the time of policy change as reflected by their intercept in the mixed effects model.
Citation: The American Society of Tropical Medicine and Hygiene 89, 5; 10.4269/ajtmh.13-0129
SP.
From Figure 1 it can be observed that many countries never recommended SP, but changed directly from CQ to an ACT. In fact, only nine African countries recommended SP as a first-line therapy, but Figure S7 shows that actual use of SP was still common. To estimate SP drug use, a mixed effects model was fitted using SP use data in all countries. Figure S8A and B show the country-level intercepts and slopes, respectively, with time measured as post 1999. Figure 5 visualizes the changing use of SP in each country after 1999 for countries that recommended SP as a first-line therapy and for which there is SP use data available, showing the predicted use in 1999, 2005, and 2010.
Country level drug use estimates from mixed effects model of SP use where time is measured as post 1999. SP use is represented along the horizontal axis. The intercept (that is, SP use in 1999) is represented by the black square for each country. The red lines show the change in SP use from 1999 to 2005 for each country (indicated by the length of the red line). The green line shows the drug use change from 2005 to 2010 (indicated by the length of the green line). The model parameter estimates, standard errors and p-values are given in Table S5. Countries are ordered by increasing level of their SP use in 1999 as reflected by their intercept in the mixed effects model.
Citation: The American Society of Tropical Medicine and Hygiene 89, 5; 10.4269/ajtmh.13-0129
There was a significant downward trend in SP usage after policy change from SP to ACTs (logistic regression: slope = −0.53, P < 0.001). However, at this rate of SP reduction it would still take 1.3 years for the odds of SP use to fall by 50%. There were insufficient data to fit a mixed effects model to the SP usage data after it was replaced as the recommended first-line treatment.
Correlation of SP use to SP resistance.
The correlation was assessed between SP use, estimated in this work, and the changes in a molecular marker, dhps540E, known to be highly correlated with trends in SP efficacy.21 The prevalence of the dhps540E genotype at the time of a change to SP is poorly correlated with SP use (Table 2). Even when reported SP drug use declined before the change to an ACT, the increase in drug resistance (using upward trends in molecular marker prevalence as a surrogate) continued. In East Africa, SP use and dhps540E prevalence were already high when Malawi, Kenya and Tanzania adopted SP, and dhps540E continued to increase despite large reductions in SP use. In Zimbabwe, Burundi, and DRC, drug use was low throughout the period measured, but increases in dhps540E prevalence were still observed. Cote d'Ivoire is the exception, where SP drug use was extremely low (2%) and the dhps540E marker was virtually absent for the period when SP was the first line drug. The correlation was measured between drug use and dhps540E prevalence in the seven countries during the years when SP was the first line (Figure 6). A strong correlation was observed in Malawi (ρ = −0.97, P < 0.001), Kenya (ρ = −0.91, P = 0.004), and Tanzania, (ρ = −0.88, P = 0.12). The remaining countries did not use enough SP for a relationship to be informative.
Countries recommending SP for which SP usage estimates are available, year of policy changes, and estimated dhps540E prevalence*
| Country | National policy change to SP | National policy change to ACT | ||||
|---|---|---|---|---|---|---|
| Year | SP use (estimated %) | dhps540E prevalence (estimated %) | Year | SP use (estimated %) | dhps540E prevalence (estimated %) | |
| Malawi | 1993 | 58 | 46 | 2007 | 13 | 96 |
| Kenya | 1998 | 41 | 31 | 2004 | 9 | 91 |
| Zimbabwe | 2000 | < 1 | 14 | 2004 | 1 | 26 |
| Burundi | 2001 | 2 | 41 | 2003 | 2 | 68 |
| DRC | 2001 | < 1 | 10 | 2005 | 2 | 33 |
| Tanzania | 2001 | 52 | 30 | 2004 | 23 | 71 |
| Cote d'Ivoire | 2003 | 2 | 2 | 2005 | 2 | 3 |
The year of policy change to sulphadoxine-pyrimethamine (SP) and later to artemisinin combination therapy (ACT) are both given, along with the estimated SP usage and dhps540E prevalence in each of these years. The countries are listed in order of the year of policy change to SP. DRC refers to the Democratic Republic of Congo.
dhps540E marker prevalence versus the estimated SP drug usage, per country, during SP first line recommendation for Malawi, (black) Kenya (red), Zimbabwe (green), Burundi (dark blue), DRC (light blue), Tanzania (pink) and Cote d'Ivoire (yellow). DRC refers to the Democratic Republic of Congo.
Citation: The American Society of Tropical Medicine and Hygiene 89, 5; 10.4269/ajtmh.13-0129
ACTs.
In the years between 2005 and 2011, 49 surveys monitoring ACT usage across 31 countries were conducted. Because of the low number of surveys in each country and the low reported ACT usage (Figure S9), a mixed effects model was not fitted, but is postponed until the data set has sufficiently matured. Figure 7 shows the increasing ACT use over the period of 2005–2011 (regression slope = 0.88, P < 0.001), compared with the decreasing trends in the use of CQ (regression slope = −0.13, P < 0.001) and SP (regression slope = −0.06, P < 0.001).
CQ (red), SP (blue) and ACT (green) usage data over the time period 1999–2011 and logistic regression model fits to the data. The top subplot shows the number of countries per two-year interval that changed national antimalarial policy away from CQ (red) and SP (blue).
Citation: The American Society of Tropical Medicine and Hygiene 89, 5; 10.4269/ajtmh.13-0129
Discussion
Management of drug resistance is crucial for maintaining progress in malaria control and realizing the goal of malaria elimination. One element of effective management is identification of foci of resistance and understanding the factors that shape the trajectory as resistant parasites spread. These factors can be identified by analyzing the historical and contemporary data on patterns of resistance to drugs that have already failed and insight can be gained by modeling those patterns.
Models have been constructed, using the rich data set available on CQ and SP use in 40 African countries, to define the trends in actual drug use over time in each country. The model for CQ use trends post policy change in African countries showed striking differences in trends even in neighboring countries. The absence of regional patterns in the rate of reduction of CQ use suggests that supply and demand side factors vary considerably by country. With this foundation, the model can be extended to identify additional factors that influence the rate of change of drug use.
The model quantifies the lag between the adoption of a policy for treatment of suspected P.f. infections and the impact of that policy on actual drug use. The time required for a 50% reduction in the odds of CQ usage was 2.4 years and 1.3 years for SP.
It has been suggested that the removal of drug selection pressure can result in the return of parasites susceptible to the drug,16,23,24 an effect observed when CQ was withdrawn in Malawi.25,26 However, a decline will not occur if drug usage continues after a policy change or if other drugs with related resistance mechanisms exert pressure. For example amodiaquine use selects for resistance to CQ,27 and the widespread use of trimethoprim-sulfamethoxazole (Cotrimoxazole) for various bacterial infections and in prophylaxis for human immunodeficiency virus (HIV) acts on the same drug targets as SP.28
The relationship between SP use and drug resistance in key African countries that recommended SP as a first-line therapy was investigated. This revealed that Burundi, Zimbabwe, and the DRC showed moderate prevalence of SP resistance markers at the time of SP introduction and continued increases in those markers during the time when SP was the national policy, but apparently was used very modestly. One explanation for this is migration of SP-resistant parasites from neighboring countries in East Africa, such as Kenya, Tanzania, and Malawi, which have a very high prevalence of SP-resistant parasites and sustained SP drug pressure. In contrast, Côte d'Ivoire in West Africa is surrounded by countries that show similar low levels of SP use, and the resistance markers maintained low prevalence over the whole period. SP is currently recommended for chemoprevention14 and appears in most national guidelines for intermittent preventative therapy for pregnant women and infants,29 which may help to explain the prolonged SP usage. The CQ use data have not been analyzed in light of molecular markers associated with CQ resistance because, at this time, a comprehensive database of molecular markers that confer resistance to CQ is yet to be completed.
CQ is not currently recommended as part of the treatment of P.f. malaria in Africa, and only a handful of countries with P. vivax recommend CQ. However, CQ usage has persisted for many years after policy change. Studies have shown that between 40% and 60% of those who seek treatment of fever in malaria-endemic countries access drugs in the private sector, where CQ and SP are up to 25 times less expensive than an ACT.17 In fact, this price differential was a primary motivation for the formation of the Affordable Medicines Facility—malaria (AMFm), a program designed to address this disparity.30 Furthermore, despite treatment guidelines that recommend ACTs, SP and CQ remain registered in many countries and because they are authorized to move through the marketplace, are highly available.17
There are several limitations of the analysis. First, consumption of antimalarials for laboratory-confirmed malaria infection might differ from estimates derived from children with fever. Second, drug use in other age groups may not follow the same trends as those in children < 5 years of age. Third, there may be substantial differences in drug use within countries and these have not been considered. Fourth, there was no available measure for the quality of antimalarial received. Finally, some mothers were unable to identify the drugs that were used, which is likely to underestimate the true usage of the drugs but would be unlikely to change the main findings.
Countries in Africa have changed antimalarial policy to ACTs in the last decade, and increasing access to these drugs, both in the public and private sectors, has been supported by large initiatives and funding agencies, including Global Funds, AMFm, the President's Malaria Initiative, the World Bank, and UNITAID. Unfortunately, artemisinin resistance has arisen in Southeast Asia and could spread to, or emerge in, Africa or Latin America. Moreover, the ACTs artemether-lumefantrine, amodiaquine-artesunate, and dihydroartemisinin-piperaquine are now being deployed intensively. Drug pressure is believed to be an important driver of resistance and continuous monitoring of usage and efficacy of these antimalarials is vital to guide policies. Initiatives such as the DHS, MICS, and ACTwatch will be essential for providing the necessary data.30 The methods described here will be a valuable tool to monitor use of ACTs and to identify the factors that influence actual drug pressure.
ACKNOWLEDGMENTS
We thank Anna Tochlin for assisting in validating the automated DHS and MICS data extraction process. Rachel Ochola and Amadou Seck assisted in the extraction of drug policy information from the literature.
- 1.↑
Nuwaha F, 2001. The challenge of chloroquine-resistant malaria in sub-Saharan Africa. Health Policy Plan 16: 1–12.
- 4.↑
Harinasuta T, Suntharasamai P, Viravan C, 1965. Chloroquine-resistant falciparum malaria in Thailand. Lancet 2: 657–660.
- 5.
Moore DV, Lanier JE, 1961. Observations on two Plasmodium falciparum infections with an abnormal response to chloroquine. Am J Trop Med Hyg 10: 5–9.
- 6.↑
Young MD, Moore DV, 1961. Chloroquine resistance in Plasmodium falciparum. Am J Trop Med Hyg 10: 317–320.
- 7.↑
Kihamia CM, Gill HS, 1982. Chloroquine-resistant falciparum malaria in semi-immune African Tanzaniana. Lancet 2: 43.
- 8.↑
Fogh S, Jepsen S, Effersoe P, 1979. Chloroquine-resistant Plasmodium falciparum malaria in Kenya. Trans R Soc Trop Med Hyg 73: 228–229.
- 9.↑
Hellgren U, Ardal OK, Lebbad M, Rombo L, 1987. Is chloroquine-resistant Plasmodium falciparum malaria emerging in Senegal or The Gambia? Trans R Soc Trop Med Hyg 81: 728.
- 10.↑
Kyronseppa H, Lumio J, Ukkonen R, Pettersson T, 1984. Chloroquine-resistant malaria from Angola. Lancet 1: 1244.
- 11.↑
Korenromp EL, Williams BG, Gouws E, Dye C, Snow RW, 2003. Measurement of trends in childhood malaria mortality in Africa: an assessment of progress toward targets based on verbal autopsy. Lancet Infect Dis 3: 349–358.
- 12.↑
Trape JF, 2001. The public health impact of chloroquine resistance in Africa. Am J Trop Med Hyg 64 (Suppl): 12–17.
- 13.↑
Bjorkman A, Phillips-Howard P, 1990. The epidemiology of drug-resistant malaria. Trans R Soc Trop Med Hyg 84: 177–180.
- 14.↑
World Health Organization, 2012. Country antimalarial drug policies by region. Available at: http://www.who.int/malaria/am_drug_policies_by_region_afro/en/index.html. Accessed January 2013.
- 15.↑
World Health Organization, 2012. WHO Policy Recommendation: Seasonal Malaria Chemoprevention (SMC) for Plasmodium falciparum malaria control in highly seasonal transmission areas of the Sahel sub-region in Africa. Available at: http://www.who.int/malaria/publications/atoz/smc_policy_recommendation_en_032012.pdf. Accessed January 2013.
- 16.↑
Frosch AEP, Venkatesan M, Laufer MK, 2011. Patterns of chloroquine use and resistance in sub-Saharan Africa: a systematic review of household survey data and molecular data. Malar J 10: 116.
- 17.↑
O'Connell KA, Gatakaa H, Poyer S, Njogu J, Evance I, Munroe E, Solomon T, Goodman C, Hanson K, Zinsou C, Akulayi L, Raharinjatovo J, Arogundade E, Buyungo P, Mpasela F, Adjibabi CB, Agbango JA, Ramarosandratana BF, Coker B, Rubahika D, Hamainza B, Chapman S, Shewchuk T, Chavasse D, 2011. Got ACTs? Availability, price, market share and provider knowledge of anti-malarial medicines in public and private sector outlets in six malaria-endemic countries. Malar J 10: 326.
- 18.↑
USAID. Measure DHS Demographic Health Surveys. Available at: http://www.measuredhs.com/. Accessed January 2013.
- 19.↑
Childinfo. Multiple Indicator Cluster Surveys. Available at: http://www.childinfo.org. Accessed January 2013.
- 20.↑
Naidoo I, Roper C, 2010. Following the path of most resistance: dhpsK540E dispersal in African Plasmodium falciparum. Trends Parasitol 26: 447–456.
- 21.↑
Naidoo I, Roper C, 2011. Drug resistance maps to guide intermittent preventive treatment of malaria in African infants. Parasitology 138: 1469–1479.
- 22.↑
Flegg JA, Patil AP, Venkatesan M, Roper C, Naidoo I, Hay SI, Sibley CH, Guerin PJ, 2013. Spatiotemporal mathematical modelling of mutations of the dhps gene in African Plasmodium falciparum. Malar J 12: 249.
- 23.↑
Mwai L, Ochong E, Abdirahman A, Kiara SM, Ward S, Kokwaro G, Sasi P, Marsh K, Borrmann S, Mackinnon M, Nzila A, 2009. Chloroquine resistance before and after its withdrawal in Kenya. Malar J 8: 106.
- 24.↑
Malisa AL, Pearce RJ, Abdulla S, Mshinda H, Kachur PS, Bloland P, Roper C, 2010. Drug coverage in treatment of malaria and the consequences for resistance evolution-evidence from the use of sulphadoxine/pyrimethamine. Malar J 9: 190.
- 25.↑
Kublin JG, Cortese JF, Njunju EM, Mukadam RAG, Wirima JJ, Kazembe PN, Djimdé AA, Kouriba B, Taylor TE, Plowe CV, 2003. Reemergence of chloroquine-sensitive Plasmodium falciparum malaria after cessation of chloroquine use in Malawi. J Infect Dis 187: 1870–1875.
- 26.↑
Mita T, Kaneko A, Lum JK, Bwijo B, Takechi M, Zungu IL, Tsukahara T, Tanabe K, Kobayakawa T, Björkman A, 2003. Recovery of chloroquine sensitivity and low prevalence of the Plasmodium falciparum chloroquine resistance transporter gene mutation K76T following the discontinuance of chloroquine use in Malawi. Am J Trop Med Hyg 68: 413–415.
- 27.↑
Djimde A, Doumbo OK, Cortese JF, Kayentao K, Doumbo S, Diourte Y, Coulibaly D, Dicko A, Su XZ, Nomura T, Fidock DA, Wellems TE, Plowe CV, 2001. A molecular marker for chloroquine-resistant falciparum malaria. N Engl J Med 344: 257–263.
- 28.↑
Kazanjian P, Locke AB, Hossler PA, Lane BR, Bartlett MS, Smith JW, Cannon M, Meshnick SR, 1998. Pneumocystis carinii mutations associated with sulfa and sulfone prophylaxis failures in AIDS patients. AIDS 12: 873.
- 29.↑
van Eijk AM, Hill J, Alegana VA, Kirui V, Gething PW, ter Kuile FO, Snow RW, 2011. Coverage of malaria protection in pregnant women in sub-Saharan Africa: A synthesis and analysis of national survey data. Lancet Infect Dis 11: 190–207.
- 30.↑
The Global Fund to Fight AIDS TaM. Affordable Medicines Facility - Malaria. Available at: http://www.theglobalfund.org/en/amfm/. Accessed November 2012.
- 31.
Shewchuk T, O'Connell KA, Goodman C, Hanson K, Chapman S, Chavasse D, 2011. The ACTwatch project: methods to describe anti-malarial markets in seven countries. Malar J 10: 325.