


Introduction
Epidemic cholera was introduced to Haiti for the first time in October 2010,1,2 causing one of the worst cholera outbreaks in recorded history with 651,339 illnesses and 8,053 deaths as of March 24, 2013.3 Because infection with toxigenic Vibrio cholerae O1 results in a wide spectrum of illness,4 estimates of disease severity are important for projecting resource needs (e.g., intravenous [IV] fluids and medical staffing) and planning response efforts. Most infections with toxigenic V. cholerae are asymptomatic; a smaller proportion of infected persons develop mild or moderate diarrhea, and only a small percentage of those exposed develop severe cholera.4 Previous studies in Bangladesh, a country in which cholera has been endemic for centuries, have suggested that an estimated 2% of persons infected with typical seventh pandemic V. cholerae O1 biotype El Tor develop severe cholera compared with 11% of those infected with the classical biotype.5–7 The relevance of these estimates in cholera-naive countries such as Haiti is unknown. In addition, altered or atypical strains with characteristics of both biotypes have emerged in South Asia,8 Africa,9 and now in Haiti.9 The V. cholerae strain introduced to Haiti is a fully virulent serogroup O1, serotype Ogawa, with an integrated El Tor type phage (CTXΦ)El Tor that expresses the classical ctxB-1 allele.9 Limited evidence suggests that certain atypical El Tor strains might be more virulent than previous El Tor strains.10,11
Host factors play a role in determining cholera severity.12 Persons with ABO blood group O have been shown to have higher rates of severe cholera compared with persons with other ABO blood groups.13–15 Prevalence of blood group O ranges widely across populations,16 which likely influences the resulting clinical spectrum of illness from V. cholerae infection. We found no published reports of blood group distribution in Haiti. Other risk factors related to development of symptomatic cholera are low gastric acidity,17,18 retinol deficiency,12 and, potentially, iron deficiency.19
Antibodies measured by the vibriocidal test, which is an antibody-dependent, complement-mediated lytic assay, are considered to be markers of recent exposure to V. cholerae. Vibriocidal assays are widely used as evidence of infection in serosurveys,5,6 case–control studies,14 and for surveillance in the United States.20 When used in populations, results correlate well with protection from V. cholerae infection and symptomatic disease.21 In volunteer studies, vibriocidal titers peak soon after exposure and usually return to baseline within a year in the absence of re-infection.22 Although vibriocidal antibodies are cross-reactive between the two V. cholerae serotypes, Ogawa and Inaba, responses are typically highest to the homologous strain. Serum IgG to cholera toxin (CT) are not associated with immunity, but are markers of recent or previous toxigenic V. cholerae infection, and typically remain elevated for over a year.23,24 However, cross-reactivity between CT and the heat-labile toxin produced by some enterotoxigenic Escherichia coli can produce false-positive results in anti-CT testing, which limits its usefulness in determining recent V. cholerae infections. In cholera-endemic areas, serum IgA anti-CT has a similar decay pattern to vibriocidal antibodies and may be associated with immunity.12,24
To characterize the spectrum of illness resulting from epidemic V. cholerae infection in a Haitian population and examine risk factors for severe disease, we conducted a seroepidemiologic survey in Grande Saline Commune, Artibonite Department, Haiti. This commune reported a high cholera attack rate (18%) from October 2010 through March 2011 (Ministère de la Santé Publique et de la Population [MSPP] Surveillance, unpublished data), suggestive of widespread V. cholerae exposure. Grande Saline, which is located along the terminal portion of the Artibonite River, was one of the first communes affected by the outbreak25 and is highly reliant on river water for agricultural and domestic use. The commune's estimated 21,131 residents26 live primarily in 13 villages situated along a single road that follows the river. In the five months between the start of the outbreak and the seroepidemiologic study, the commune was served by a single cholera treatment center. We interviewed participants regarding cholera symptoms and treatment and collected serum for vibriocidal and anti-CT testing as markers of V. cholerae exposure.
Materials and Methods
Study design and participant selection.
During March 22–April 6, 2011, we conducted a cross-sectional seroepidemiologic survey in Grande Saline Commune. All consenting residents ≥ 2 years old from selected households were eligible for enrollment. After accounting for non-participation and design effect, our target sample was 600 households, based on assumptions of four consenting persons per household (for 2,400 participants) and a 75% V. cholerae infection rate. The true infection rate was unknown; 75% was chosen for these calculations because the high reported cholera attack rate in the commune suggested widespread exposure. This sample size would estimate the proportion of infected persons who develop severe disease to within 4%, assuming 5% of seropositive participants developed severe disease (given previous estimates of 2–11%).5–7 We used a type I error rate of 5% and power of 80% for sample size calculations.
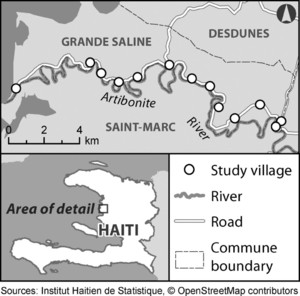
The sampling frame included all households within the commune located in the commune's 13 villages (Figure 1). Local authorities reported that nearly all commune residents resided within these villages, which are all located along the commune's main road. We selected households within each village in proportion to population estimates from local authorities because current census data were not available at the municipal level. Local community health workers identified subsections of each village. Study teams enrolled households within all subsections by starting at local landmarks within each section and moving sequentially from household to household. We used satellite maps of villages to minimize exclusion of household groups.

Grande Saline Commune, Haiti, with locations of 13 cholera serosurvey study villages.
Citation: The American Society of Tropical Medicine and Hygiene 89, 4; 10.4269/ajtmh.13-0208
Data and serum collection.
Study teams interviewed participants by using a Visual CE (SYWARE, Cambridge, MA) electronic questionnaire on a personal digital assistant. The survey included questions about demographic and household characteristics, reported cholera diagnosis by a health care provider, diarrheal symptoms and treatment, antacid use, and deaths caused by cholera within the household since the start of the outbreak in October 2010. Within each household, we asked the first participant encountered (or parent or guardian for children less than 12 years old) about household characteristics (e.g., number of persons in household and primary water source) and individual characteristics, and asked subsequent participants only about individual characteristics. We used a household identification number to link records within a household. All information was self-reported (or for children < 12 years old, reported by a parent or guardian), including clinical information; detailed clinical records were not available. We collected a single blood specimen from consenting participants as described below.
Human subjects protection.
Institutional Review Boards from the Haitian National Ethics Committee (Protocol #2011-FWD-CHOLERA-01) and the U.S. Centers for Disease Control and Prevention (CDC Protocol #6038) granted approval for this study, including for testing of control serum specimens. Haitian interviewers provided participants with oral and written explanations of the study. Participants marked checkboxes to indicate informed consent (adults ≥ 18 years old), parent or guardian permission (children < 18 years old), and child assent (children 7–17 years old). No personal identifiers were collected.
Serum collection and processing.
Blood specimens were collected in volumes consistent with participants' age and weight (maximum = 10 mL) in Vacutainer (Tiger Red/Black Top; Becton-Dickinson Laboratories, Franklin Lakes, NJ) serum separator tubes and transported on cold packs to the local health center in Grand Saline Commune. At a temporary serum processing laboratory in the health center, serum was separated after centrifuging the blood specimens, labeled, and stored on cold packs until the end of each workday. Serum specimens were transferred to a refrigerator at the Hôpital Albert Schweitzer, Haiti, and were transported twice a week on cold packs to the National Public Health Laboratory in Port-au-Prince. They were then held refrigerated until shipment to CDC (Atlanta, GA). At CDC, specimens were inventoried and accessioned, and each specimen was divided into 0.5-mL aliquots and frozen at −80°C. Fifty unlinked control serum specimens collected in Haiti before the cholera outbreak were included to determine pre-2010 antibody levels in this population.
Strains.
Two V. cholerae strains from Haiti, 2010EL-1786 (serotype Ogawa) and 2012EL-1407 (serotype Inaba), were used as target antigens in the vibriocidal assays. The complete genome sequence of 2010EL-1786 has been published.27 The Inaba strain 2012EL-1407 emerged in Haiti in March of 2012.28
Preliminary bacterial growth curves aided in standardizing the inoculum, time of incubation, and growth medium necessary to achieve a target inoculum of 3.0 × 10⁷ colony-forming units/mL of live bacteria in the early log phase of growth. The Ogawa isolate was grown to early log phase in BactoTM Heart Infusion Broth (Becton Dickinson and Company, Sparks, MD), divided into aliquots, and frozen at −80°C. From pilot study results, we concluded that 3 hours of incubation at 37°C of a standard inoculum from the frozen stock yielded 3.0 × 10⁷ colony-forming units/mL. Thereafter, on each assay occasion we determined the final concentration of live bacteria. If the counts did not fall within 1 SD of the average of all accepted runs, we rejected the previous day's assay. We repeated this process for the Inaba serotype.
Complement.
Three lots of commercial guinea pig complement (Innovative Research, Novi, MI) were tested in pilot studies. The best performing lot was selected, and all serotype-specific assays were run using the same lot. Pilot studies of complement activity aided in standardizing the assay to assure addition of excess complement. Controls were run to ensure that commercial complement did not contain naturally occurring vibriocidal activity.
Controls.
Known positive serum specimens obtained from patients with confirmed cholera infections and known negative specimens were run on each test occurrence for each assay. Controls were unlinked from any patient identifiers.
Vibriocidal assays.
Both serotype-specific assays were validated with known positive and negative serum specimens and a positive cutoff was established by receiver operating characteristic analysis. The assays in a 96-well microtiter format were set up accordingly: two-fold dilutions of heat-inactivated control and test serum samplers were titrated by using a BioMek NXP Laboratory Automation Workstation (Beckman Coulter, Brea, CA). After an initial 1:10 dilution of each serum, 11 two-fold dilutions were made to a final concentration of 1:40,560. Every serum specimen was run in duplicate. All specimens were tested with serotype Ogawa and repeated with serotype Inaba.
For each assay, the appropriate V. cholerae strain was cultured at 37°C to early log phase and washed twice. Cultures and complement were mixed, added to each serum dilution, incubated for 1 hour at 37°C, then overlayed with warmed BactoTM Heart Infusion Broth. After 2.5 hours at 37°C, wells were read visually for turbidity indicating growth of bacteria. The titer was expressed as the reciprocal of the highest dilution of serum with > 50% reduction in turbidity. If positive controls results did not fall within one dilution ± 1:640, or if the negative control was positive at any dilution, the assay was rejected and re-tested. In addition, if plate counts did not fall within 1 SD of the average of previously validated specimens, the corresponding assay was rejected and re-tested.
Anti-CT IgG and IgA.
We tested serum specimens in an indirect enzyme-linked immunosorbent assay (ELISA) format using Immulon 2HB (Thermo Scientific, Rochester, NY) microtiter plates coated with commercially available CT (Sigma, St. Louis, MO). Individual serum specimens were diluted 1:50 in phosphate-buffered saline with 1% bovine serum albumin and diluted two-fold to 1:1600, followed by the addition of mouse anti-human IgG monoclonal antibody HP604329 or commercial goat anti-human IgA (Invitrogen, Frederick, MD) conjugated to alkaline phosphatase. After incubation for 1 hour at 37°C, we added disodium p-nitrophenyl phosphate (Sigma), stopped the reaction with 3M NaOH, and read optical densities (ODs) at 405 nm with a Spectramax Plus 384 device (Molecular Devices, Sunnydale, CA).
We optimized antigen, serum, and conjugates by checkerboard titrations before testing and validated ELISA results by using positive and negative serum from patients with and without cholera, respectively. Statistical thresholds were calculated by using receiver operating characteristic analysis for each assay and antibody class.
Blood group.
Since red cells were not available, we determined ABO blood group for a subset of participants by using the reverse-typing test tube method with A1 and B Referencells (Immucor, Norcross, GA) as specified by the manufacturer. Anti-A and Anti-B murine monoclonal antibodies (Immucor) were tested as controls. A limitation of this approach is that it does not directly detect ABO blood groups but rather depends on the presence of anti-A and anti-B antibodies in serum.
Data analysis.
Survey data were downloaded from personal digital assistants to a Microsoft (Redmond, WA) Access 2003 database and analyzed by using SAS version 9.3 (SAS Institute, Cary, NC).
Seropositivity was determined by measuring vibriocidal antibody responses to Ogawa and Inaba serotypes from isolates obtained from Haiti. Secondary analyses examined anti-CT IgA and anti-CT IgG results. We defined clinical severity of disease by level of treatment required, similar to definitions from previous bacteriological surveys.5,6 All clinical data were self-reported. Participants who reported a cholera diagnosis but not watery diarrhea (i.e., logically inconsistent responses) were excluded from analyses describing cholera and disease severity.
Severe disease was defined as diarrhea with overnight hospitalization at a health facility and receipt of IV fluids, moderate disease as diarrhea and a visit to a health facility but not meeting criteria for severe disease, and mild disease as diarrhea without a health facility visit.
We calculated basic frequencies, as well as odds ratios (ORs) and 95% confidence intervals (CIs) by using simple logistic regression adjusted for household design effect. We used proportional-odds cumulative logistic regression models to assess influence of potential risk factors on disease severity (classified on a four-level ordinal scale: severe, moderate, mild, or asymptomatic), adjusting for age quartile, and antacid use. Predictors were blood group and socioeconomic characteristics (literacy, speaking French, and household possession of a cell phone, radio, or electricity). For each model, we calculated the score test to assess whether the proportional odds assumption was contradicted.
Results
Enrollment.
During the study period, we enrolled 2,622 Grande Saline residents ≥ 2 years old from 1,240 households. There were an average of 4.4 (SD = 2.5) eligible persons per household of whom we enrolled a mean of 2.1 participants (range = 1–10). Enrollment targets were met in each of the commune's 13 villages. We collected serum from 2,527 (96%) participants.
Demographic and socioeconomic characteristics.
The median age of participants was 23 years (range = 2–90 years), and 59% were female (Table 1). The median age for males (18 years) was less than the median age for females (26 years); among adults ≥ 18 years old, 1,013 (65%) were women, and 544 (35%) were men. Among all participants, 1,394 (53%) were literate, 300 (11%) spoke French, and 257 (10%) had attended at least some secondary school. Among 1,557 adults ≥ 18 years old, 729 (47%) were literate, 220 (14%) spoke French, and 219 (14%) attended at least some secondary school. The most common occupations among adults were rice farming (565, 36%), farming other crops (343, 22%), and vending or trading (307, 20%).
Demographic characteristics and diarrhea histories of 2,622 cholera serosurvey participants, Grande Saline, Haiti, 2011*
| Characteristic | No. | % |
|---|---|---|
| Age quartile, years | ||
| 2–12 | 721 | 28 |
| 13–23 | 595 | 23 |
| 24–43 | 667 | 25 |
| 44–90 | 636 | 24 |
| Missing | 3 | < 1 |
| Sex | ||
| F | 1,553 | 59 |
| M | 1,069 | 41 |
| Literacy | ||
| Illiterate | 1,220 | 47 |
| Literate | 1,394 | 53 |
| Missing | 8 | < 1 |
| Secondary education | ||
| No | 2,365 | 90 |
| Yes | 257 | 10 |
| Speaks French | ||
| No | 2,322 | 89 |
| Yes | 300 | 11 |
| Reported HIV diagnosis* | ||
| No | 2,500 | 95 |
| Yes | 11 | < 1 |
| Refused/do not know | 108 | 4 |
| Missing | 3 | < 1 |
| Reported pregnant, among females 10–55 years old (n = 1,040) | ||
| No | 963 | 93 |
| Yes | 77 | 7 |
| Reported antacid use | ||
| No | 2,198 | 84 |
| Yes | 418 | 16 |
| Refused/do not know | 3 | < 1 |
| Missing | 3 | < 1 |
| Watery diarrhea since October 2010† | ||
| No | 1,998 | 79 |
| Yes | 541 | 21 |
| Refused/do not know | 3 | < 1 |
| Missing | 1 | < 1 |
| Cholera diagnosis since October 2010† | ||
| No | 2,074 | 82 |
| Yes | 466 | 18 |
| Missing | 3 | < 1 |
HIV = human immunodeficiency virus.
Excludes 79 participants who reported cholera but not watery diarrhea.
Household characteristics.
Among the 1,240 households in the study, 603 (49%) owned a cellular phone, 434 (35%) owned a radio, and 52 (4%) had electricity (including from generators). Regarding primary drinking water source, 472 (38%) households bought water from vendors, 398 (32%) households used a canal or the Artibonite River, 180 (15%) used a public or private tap, and the remaining 190 (15%) used other sources, including wells. Of 962 (78%) households that reported having treated their drinking water since the outbreak began, 953 (99%) used at least one of three treatment methods: 513 (53%) used chlorine tablets, 246 (26%) used filters, 91 (9%) used chlorine solution, and 112 (12%) used a combination of these methods. No additional information was collected on alternate sources of drinking water or the regularity of drinking water treatment.
Health characteristics.
Eleven (< 1%) participants reported having been diagnosed with HIV infection, 77 (7%) females 10–55 years old reported being pregnant, and 418 (16%) participants reported taking antacids in the previous six months.
Blood group testing.
We tested a subset of 866 participants for ABO blood groups by reverse typing; 386 (45%) had blood group O, 242 (28%) had group A, 194 (22%) had group B, and 44 (5%) had group AB.
Diarrhea and cholera.
Among all participants, 541 (21%) reported an episode of watery diarrhea since the start of the cholera outbreak in October 2010, including 466 (18%) who reported a cholera diagnosis from a health care worker (Table 1). Seventy-nine (3%) participants reported a cholera diagnosis but no watery diarrhea and were excluded from cholera and disease severity analyses. Among the 541 participants reporting watery diarrhea, 83% reported feces that resembled water used to cook rice (rice water stool), 71% reported painful leg cramps, 43% reported vomiting more than once, and 11% reported bloody stool (Table 2). Participants with watery diarrhea who reported a cholera diagnosis were more than twice as likely as participants with watery diarrhea without a cholera diagnosis to report each of these symptoms except for bloody stool, for which the proportions were similar (11% versus 9%, respectively). Participants with a cholera diagnosis reported a median of seven stools on the worst day of illness compared with three for those not reporting a cholera diagnosis. Most participants reported a date of diarrhea onset during October 15–November 31, 2010 (Figure 2A). This distribution of illness over time was similar to the distribution of cholera cases reported to Haiti's national cholera surveillance system by local health care providers in Grande Saline (Figure 2B).
Clinical characteristics of cholera serosurvey participants reporting watery diarrhea, Grande Saline, Haiti, March 22–April 6, 2011*
| Characteristic | Cholera diagnosis (n = 466) | Watery diarrhea only (n = 75) | Any watery diarrhea (n = 541) | |||
|---|---|---|---|---|---|---|
| No. or median | % or IQR | No. or median | % or IQR | No. or median | % or IQR | |
| Rice water stool | 429 | 92 | 19 | 25 | 448 | 83 |
| Leg cramps | 361 | 77 | 23 | 31 | 384 | 71 |
| Vomited more than once | 225 | 48 | 10 | 13 | 235 | 43 |
| Bloody stool | 50 | 11 | 7 | 9 | 57 | 11 |
| Maximum no. stools in 24 hours | 7 | 4–10 | 3 | 3–4 | 6 | 3–10 |
| Used ORS at home | 405 | 87 | 45 | 60 | 450 | 83 |
| Took antibiotic | 315 | 68 | 47 | 63 | 362 | 67 |
| Went to HF | 366 | 79 | 21 | 28 | 387 | 72 |
| Treatment at HF (among participants who visited HF) | (n = 366) | (n = 21) | (n = 387) | |||
| Received ORS at HF | 329 | 90 | 11 | 52 | 340 | 88 |
| Received IV fluids at HF | 213 | 58 | 7 | 33 | 220 | 57 |
| Hospitalized overnight | 191 | 52 | 5 | 24 | 196 | 51 |
| IV fluids and hospitalization | 157 | 43 | 0 | 0 | 157 | 41 |
| Disease severity | (n = 466) | (n = 75) | (n = 541) | |||
| Mild† | 99 | 21 | 54 | 72 | 153 | 2 |
| Moderate‡ | 209 | 45 | 21 | 28 | 230 | 43 |
| Severe§ | 157 | 34 | 0 | 0 | 157 | 29 |
IQR = interquartile range; ORS = oral rehydration salts; HF = health facility; IV = intravenous.
Defined as watery diarrhea without a visit to an HF.
Defined as watery diarrhea with an HF visit, but not meeting criteria for severe disease.
Defined as watery diarrhea with receipt of IV fluids and overnight hospitalization.
A, Self-reported dates of watery diarrhea onset for participants reporting a cholera diagnosis, cholera serosurvey, Grande Saline, Haiti, 2010–2011 (n = 354). B, Grande Saline cholera cases reported to Ministry of Health and Population (MSPP) surveillance, Haiti, 2010–2011.
Citation: The American Society of Tropical Medicine and Hygiene 89, 4; 10.4269/ajtmh.13-0208
Regarding treatment, 87% of participants who reported a cholera diagnosis had used oral rehydration salts at home, 68% took an antibiotic during the diarrheal episode, and 79% (366 participants) sought treatment at a health facility. Among the 366 participants who reported a cholera diagnosis and treatment at a health facility, 90% reported receiving oral rehydration salts during their stay, 58% reported receiving IV fluids, and 52% reported being hospitalized overnight; 157 (43%) reported both IV fluids and overnight hospitalization.
We classified disease severity among participants with watery diarrhea based on level of treatment received (Table 2). Of participants reporting a cholera diagnosis, 21% had mild disease, 45% had moderate disease, and 34% had severe disease. In comparison, 72% of participants with watery diarrhea but no cholera diagnosis had mild disease, and the remaining 28% had moderate disease; none met criteria for severe disease.
Bivariable analysis of reported cholera.
A higher proportion of participants in the oldest quartile (> 43 years old) reported a cholera diagnosis (23%) than participants in younger age quartiles (16–17%) (Table 3). A cholera diagnosis was reported in similar proportions by females and males (OR = 1.05, 95% CI = 0.85–1.29). A cholera diagnosis was more commonly reported by participants who were illiterate (OR = 1.73, 95% CI = 1.40–2.14), did not speak French (OR = 1.86, 95% CI = 1.23–2.81), and who reported using antacids (OR = 1.73, 95% CI = 1.32–2.27). A cholera diagnosis was also more commonly reported by participants in households lacking a cell phone (OR = 1.35, 95% CI = 1.07–1.69), radio (OR = 1.39, 95% CI = 1.09–1.78), and electricity (OR = 2.22, 95% CI = 1.07–4.64). Equal proportions of participants with blood group O and those with other blood groups reported a cholera diagnosis (23%).
Comparisons of demographic and clinical characteristics with reported cholera diagnosis, cholera serosurvey, Grande Saline, Haiti, March 22–April 6, 2011 (n = 2,543)*
| Characteristic | No. reporting cholera diagnosis | % | OR† | 95% CI |
|---|---|---|---|---|
| Total | 466 | 18 | ||
| Age quartile, years | ||||
| 2–12 | 114 | 16 | Ref | |
| 13–23 | 97 | 17 | 1.06 | 0.79–1.43 |
| 24–43 | 107 | 16 | 1.02 | 0.76–1.37 |
| 44–90 | 148 | 23 | 1.63 | 1.23–2.17‡ |
| Sex | ||||
| Female | 279 | 19 | 1.05 | 0.85–1.29 |
| Male | 187 | 18 | Ref | |
| Literacy | ||||
| Illiterate | 269 | 23 | 1.73 | 1.40–2.14‡ |
| Literate | 195 | 14 | Ref | |
| Speaks French | ||||
| No | 434 | 19 | 1.86 | 1.23–2.81‡ |
| Yes | 32 | 11 | Ref | |
| Reported HIV diagnosis | ||||
| No | 442 | 18 | 1.01 | 0.22–4.64 |
| Yes | 2 | 18 | Ref | |
| Reported pregnant, among females 10–55 years (n = 1,040) | ||||
| Pregnant | 20 | 26 | 1.63 | 0.96–2.78 |
| Not pregnant | 165 | 18 | Ref | |
| Reported antacid use | ||||
| User | 103 | 26 | 1.73 | 1.32–2.27‡ |
| Non-user | 362 | 17 | Ref | |
| Cell phone in household | ||||
| No | 261 | 21 | 1.35 | 1.07–1.69‡ |
| Yes | 205 | 16 | Ref | |
| Radio in household | ||||
| No | 328 | 20 | 1.39 | 1.09–1.78‡ |
| Yes | 138 | 15 | Ref | |
| Electricity in household | ||||
| No | 457 | 19 | 2.22 | 1.07–4.64‡ |
| Yes | 9 | 9 | Ref | |
| Primary water source from river or canal | ||||
| No | 298 | 18 | 0.98 | 0.77–1.24 |
| Yes | 165 | 18 | Ref | |
| Treated drinking water | ||||
| No | 85 | 14 | 0.78 | 0.58–1.04 |
| Yes | 378 | 19 | Ref | |
| Blood group testing (n = 837) | ||||
| O | 85 | 23 | 0.97 | 0.70–1.36 |
| A, B, or AB | 107 | 23 | Ref | |
OR = odds ratio; CI = confidence interval; Ref = referent; HIV = human immunodeficiency virus.
Estimated population OR and 95% CI calculated by bivariable logistic regression, adjusting for household design effect.
Statistically significant at alpha = 0.05.
Serum antibody testing.
Based on validation results, a titer of 320 was set as the threshold for seropositivity for the Ogawa and Inaba vibriocidal assays. Secondary analyses examined survey results using lower, more lenient, vibriocidal titers of 80 and 160. Specific OD threshold values were calculated for both anti-CT ELISAs. Among the 2,527 (96%) participants from whom we collected serum, 980 (39%) had a positive Ogawa or Inaba vibriocidal result (titer ≥ 320) (Table 4), 1,331 (53%) participants had a vibriocidal titer ≥ 160, and 1,626 (64%) had a titer ≥ 80; 732 (29%) participants had a positive anti-CT test result for IgA or IgG. None of the 50 pre-epidemic serum specimens had a vibriocidal Ogawa titer > 80; two had a vibriocidal Inaba titer of 320.
Serum testing for Vibrio cholerae antibodies and blood group among 2,527 cholera serosurvey participants, Grande Saline, Haiti, March 22–April 6, 2011
| Serum testing, titer | Positive | |
|---|---|---|
| No. | % | |
| Vibriocidal* ≥ 320 | 980 | 39 |
| Vibriocidal Ogawa ≥ 320 | 711 | 28 |
| Vibriocidal Inaba ≥ 320 | 589 | 23 |
| Vibriocidal* ≥ 160 | 1,331 | 53 |
| Vibriocidal* ≥ 80 | 1,626 | 64 |
| Cholera toxin (IgA or IgG) | 732 | 29 |
| Cholera toxin IgA | 279 | 11 |
| Cholera toxin IgG | 573 | 23 |
| Vibriocidal* ≥ 320 or CT (IgA or IgG) | 1,303 | 52 |
Either vibriocidal Ogawa or Inaba assay.
Bivariable analysis of seropositivity.
Participants 13–23 years old had the highest prevalence of vibriocidal seropositivity (46%), and adults > 43 years old had the lowest (30%) (Table 5). Whereas a cholera diagnosis was most commonly reported by participants in the oldest age quartile, vibriocidal seropositivity was less common among participants in this quartile compared with the youngest quartile (OR = 0.59, 95% CI = 0.47–0.74). The prevalence of seropositivity in each age quartile varied according to the antibody test (Figure 3). Adults in the oldest age quartile (> 43 years old) had the highest seroprevalence of anti-CT IgA (17%), whereas children in the youngest age quartile (2–12 years old) had the highest seroprevalence of anti-CT IgG (35%). The prevalence of vibriocidal seropositivity did not differ by sex before or after adjustment for age. No association was seen between length of time from diarrhea to serum collection and antibody titer for any of the four assays (data not shown). Participants with blood group O were not significantly more likely to be seropositive than those with other blood groups (OR = 0.92, 95% CI = 0.69–1.22).
Comparisons of demographic and clinical characteristics with Vibrio cholerae seropositivity, cholera serosurvey, Grande Saline, Haiti, March 22–April 6, 2011 (n = 2,527)*
| Characteristic | No. seropositive† | % | OR‡ | 95% CI |
|---|---|---|---|---|
| Total | 980 | 39 | ||
| Age quartile, years | ||||
| 2–12 | 282 | 42 | Ref | |
| 13–23 | 268 | 46 | 1.20 | 0.96–1.50 |
| 24–43 | 242 | 37 | 0.82 | 0.66–1.02 |
| 44–90 | 187 | 30 | 0.59 | 0.47–0.74§ |
| Sex | ||||
| Female | 601 | 40 | 1.14 | 0.97–1.34 |
| Male | 379 | 37 | Ref | |
| Literacy | ||||
| Literate | 562 | 42 | 1.29 | 1.10–1.52§ |
| Illiterate | 416 | 36 | Ref | |
| Speaks French | ||||
| No | 868 | 39 | 1.01 | 0.78–1.30 |
| Yes | 112 | 38 | Ref | |
| Reported HIV diagnosis | ||||
| No | 937 | 39 | 1.27 | 0.32–5.12 |
| Yes | 3 | 33 | Ref | |
| Reported pregnant among women 10–55 years old (n = 1,017) | ||||
| Pregnant | 33 | 46 | 1.27 | 0.78–2.06 |
| Not pregnant | 378 | 40 | Ref | |
| Reported antacid use | ||||
| User | 142 | 35 | 0.83 | 0.67–1.03 |
| Non-user | 836 | 39 | Ref | |
| Primary water source from river or canal | ||||
| No | 629 | 39 | 1.01 | 0.84–1.21 |
| Yes | 337 | 39 | Ref | |
| Treated drinking water | ||||
| No | 216 | 38 | 0.96 | 0.78–1.18 |
| Yes | 748 | 39 | Ref | |
| Watery diarrhea since October 2010¶ | ||||
| Yes | 243 | 47 | 1.54 | 1.26–1.87§ |
| No | 706 | 37 | Ref | |
| Cholera diagnosis since October 2010¶ | ||||
| Yes | 215 | 48 | 1.59 | 1.28–1.96§ |
| No | 736 | 37 | Ref | |
| Clinical (among those with watery diarrhea, n = 517) | ||||
| Vomited more than once | ||||
| Yes | 114 | 51 | 1.33 | 0.94–1.90 |
| No | 128 | 44 | Ref | |
| Leg cramps | ||||
| Yes | 166 | 45 | 0.71 | 0.48–1.05 |
| No | 76 | 53 | Ref | |
| Rice water stool | ||||
| Yes | 211 | 49 | 1.89 | 1.14–3.12§ |
| No | 26 | 34 | Ref | |
| Bloody stool | ||||
| Yes | 25 | 46 | 1.01 | 0.60–1.70 |
| No | 179 | 46 | Ref | |
| Used ORS at home | ||||
| Yes | 208 | 48 | 1.29 | 0.82–2.04 |
| No | 35 | 42 | Ref | |
| Took antibiotic | ||||
| Yes | 160 | 46 | 0.86 | 0.61–1.22 |
| No | 81 | 49 | Ref | |
| Went to HF | ||||
| Yes | 177 | 48 | 1.14 | 0.79–1.65 |
| No | 65 | 45 | Ref | |
| Treatment (among those who visited HF, n = 370) | ||||
| Received ORS at HF | ||||
| Yes | 160 | 49 | 1.66 | 0.88–3.16 |
| No | 17 | 37 | Ref | |
| Received IV fluids at HF | ||||
| Yes | 110 | 53 | 1.59 | 1.06–2.40§ |
| No | 67 | 41 | Ref | |
| Hospitalized overnight | ||||
| Yes | 100 | 53 | 1.55 | 1.02–2.36§ |
| No | 77 | 42 | Ref | |
| IV fluids and hospitalization | ||||
| Yes | 85 | 57 | 1.82 | 1.20–2.76§ |
| No | 92 | 42 | Ref | |
| Blood group testing (n = 866) | ||||
| O | 137 | 35 | 0.92 | 0.69–1.22 |
| A, B, or AB | 180 | 38 | Ref | |
OR = odds ratio; CI = confidence interval; Ref = referent; HIV = human immunodeficiency virus; ORS = oral rehydration salts; HF = health facility; IV = intravenous.
Defined by vibriocidal Ogawa or vibriocidal Inaba titer ≥ 320.
Estimated population OR and 95% CI were calculated by bivariable logistic regression, adjusting for household design effect.
Statistically significant at alpha = 0.05.
Excludes 79 participants who reported cholera but not watery diarrhea.
Proportion of participants within each age group seropositive for Vibrio cholerae antibody tests, cholera serosurvey, Grande Saline, Haiti, 2011. Anti-CT: antibody against cholera toxin.
Citation: The American Society of Tropical Medicine and Hygiene 89, 4; 10.4269/ajtmh.13-0208
Spectrum of illness.
Among all participants, regardless of antibody status, 6.2% had severe disease, 9.1% had moderate disease, 6.0% had mild disease and 78.7% were asymptomatic (Table 6). Among the 948 participants with vibriocidal titers ≥ 320 and severity data, 9.0% had severe disease, 9.7% had moderate disease, 6.9% had mild disease, and 74.5% were asymptomatic. A higher proportion of the 717 participants with positive anti-CT results had severe disease (12.3%) than did the vibriocidal group (9.0%), and a smaller proportion were asymptomatic (68.9% versus 74.5%).
Severity spectrum of diarrheal disease among 2,447 participants with positive results for Vibrio cholerae antibody testing, cholera serosurvey, Grand Saline, Haiti, March 22–April 6, 2011*
| Antibody result | Total | Asymptomatic | Mild† | Moderate‡ | Severe§ | ||||||||
|---|---|---|---|---|---|---|---|---|---|---|---|---|---|
| No. | % | 95% CI | No. | % | 95% CI | No. | % | 95% CI | No. | % | 95% CI | ||
| Vibriocidal¶ ≥ 320 | 948 | 706 | 74.5 | 71.4–77.6 | 65 | 6.9 | 5.0–8.6 | 92 | 9.7 | 7.8–11.6 | 85 | 9.0 | 7.1–10.8 |
| Vibriocidal¶ ≥ 160 | 1,293 | 977 | 75.6 | 73.0–78.1 | 83 | 6.4 | 5.0–7.9 | 120 | 9.3 | 7.6–10.9 | 113 | 8.7 | 7.2–10.3 |
| Vibriocidal¶ ≥ 80 | 1,581 | 1,205 | 76.2 | 73.9–78.6 | 101 | 6.4 | 5.0–7.7 | 149 | 9.4 | 7.9–10.9 | 126 | 8.0 | 6.6–9.3 |
| Anti-CT positive | 717 | 494 | 68.9 | 65.3–72.5 | 52 | 7.3 | 5.3–9.2 | 83 | 11.6 | 9.2–14.0 | 88 | 12.3 | 9.8–14.7 |
| Vibriocidal¶ ≥ 320 or anti-CT positive | 1,265 | 935 | 73.9 | 71.2–76.6 | 88 | 7.0 | 5.4–8.5 | 129 | 10.2 | 8.5–11.9 | 113 | 8.9 | 7.3–10.6 |
| Vibriocidal¶ < 320 and anti-CT negative | 1,182 | 996 | 84.3 | 82.1–86.4 | 58 | 4.9 | 3.6–6.2 | 91 | 7.7 | 6.2–9.2 | 37 | 3.1 | 2.1–4.1 |
| All participants (n = 2,538) | 2,538 | 1,998 | 78.7 | 76.9–80.6 | 153 | 6.0 | 4.9–7.1 | 230 | 9.1 | 7.9–10.3 | 157 | 6.2 | 5.2–7.2 |
CI = confidence interval; CT = cholera toxin.
Defined as watery diarrhea without a visit to a health facility.
Defined as watery diarrhea with a health facility visit, but not meeting criteria for severe disease.
Defined as watery diarrhea with receipt ofintravenous fluids and overnight hospitalization.
Either vibriocidal Ogawa or Inaba assay.
Risk factors for severe cholera.
Among 77 seropositive participants with blood grouping results who reported watery diarrhea, those with blood group O were not significantly more likely than those with other blood groups to report overnight hospitalization (OR = 2.11, 95% CI = 0.81–5.49) or receipt of IV fluids (OR = 1.91, 95% CI = 0.75–4.84). Among seropositive participants, antacid use was significantly associated with increased disease severity (Table 7). After adjusting for age and antacid use, lack of a cell phone (adjusted OR [aOR] = 1.46, 95% CI = 1.06– 2.01), radio (aOR = 1.63, 95% CI = 1.15–2.32), or electricity (aOR = 2.96, 95% CI = 1.04–8.45) in the household were associated with increased disease severity among seropositive participants. Illiteracy, inability to speak French, primarily using water from the river or canal, and treating drinking water were not significantly associated with increased disease severity after adjusting for age and antacid use among the subset of seropositive participants.
Unadjusted and adjusted odds ratios for increased diarrheal illness severity among seropositive and seronegative participants, cholera serosurvey, Grande Saline, Haiti, March 22–April 6, 2011*
| Variable | Seropositive† (n = 1,303) | Seronegative (n = 1,224) | ||
|---|---|---|---|---|
| Unadjusted OR (95% CI) | Adjusted OR‡ (95% CI) | Unadjusted OR (95% CI) | Adjusted OR‡ (95% CI) | |
| Age quartile, years | ||||
| 2–12 | Ref | Ref | Ref | Ref |
| 13–23 | 0.86 (0.57– 1.28) | 0.82 (0.55–1.23) | 1.54 (1.00–2.38)§ | 1.47 (0.95–2.26) |
| 24–43 | 0.74 (0.49– 1.11) | 0.64 (0.42–0.97)§ | 2.11 (1.41–3.16)§ | 1.82 (1.20–2.77)§ |
| 44–90 | 1.36 (0.91– 2.04) | 1.13 (0.75–1.71) | 2.74 (1.84–4.07)§ | 2.34 (1.55–3.54)§ |
| Antacid use, stratified by age quartile | 1.93 (1.30– 2.85)§ | 1.99 (1.46–2.71)§ | ||
| 2–12 | 13.36 (4.28–41.74)§ | 11.12 (3.77–32.80)§ | ||
| 13–23 | 2.53 (1.21–5.29)§ | 2.10 (1.02–4.36)§ | ||
| 24–43 | 1.92 (1.13–3.27)§ | 1.60 (1.01–2.53)§ | ||
| 44–90 | 1.49 (0.89–2.51) | 1.24 (0.81–1.89) | ||
| No cell phone in household | 1.51 (1.10– 2.08)§ | 1.46 (1.06–2.01)§ | 1.14 (0.87–1.49) | 1.13 (0.86–1.49) |
| No radio in household | 1.60 (1.13–2.27)§ | 1.63 (1.15–2.32)§ | 1.24 (0.93–1.66) | 1.28 (0.95–1.71) |
| No electricity in household | 2.78 (0.99–7.85) | 2.96 (1.04–8.45)§ | 1.43 (0.67–3.08) | 1.48 (0.68–3.21) |
| Illiterate | 1.28 (0.95–1.73) | 1.18 (0.85–1.63) | 1.97 (1.49–2.60)§ | 1.93 (1.40–2.64)§ |
| Unable to speak French | 1.11 (0.68–1.82) | 1.06 (0.65–1.75) | 1.96 (1.17–3.30)§ | 2.26 (1.34–3.83)§ |
| Primary water source from river or canal | 1.16 (0.83–1.61) | 1.22 (0.87–1.70) | 0.82 (0.61–1.11) | 0.82 (0.61– 1.11) |
| Treated drinking water | 1.13 (0.77–1.64) | 1.18 (0.80–1.72) | 1.16 (0.83–1.62) | 1.18 (0.84–1.65) |
| Blood group O vs. other blood groups (n = 835) | 1.12 (0.66– 1.90) | 1.30 (0.75–2.23) | 0.90 (0.61–1.34) | 0.96 (0.65–1.43) |
Illness severity was coded on 0–3 ordinal scale (no diarrhea, diarrhea without a visit to a health facility [mild], diarrhea with a visit to health facility but not receiving intravenous fluids and overnight hospitalization [moderate], and diarrhea with receipt of intravenous fluids and overnight hospitalization [severe]). OR = odds ratio; CI = confidence interval; Ref = referent.
Defined by vibriocidal Ogawa or Inaba titer ≥ 320.
Adjusted OR was calculated by proportional-odds cumulative logistic regression adjusted for age quartile (for antacid use), antacid use (for age quartile) or age quartile and antacid use (other variables).
Statistically significant at alpha = 0.05.
Deaths within the households.
Among a subset of 589 households with information about all household members (including participants and non-participants), there were 2,396 residents, of whom 311 were reported to have had cholera (including participants). Within these households, there were 13 cholera deaths reported by study participants; estimated case-fatality rate = 4%. Based on these limited data, approximately 1 in 185 household residents died of cholera.
Discussion
Grand Saline Commune in Haiti experienced a large number of cholera cases from the very beginning of the cholera epidemic in October 2010 and had a reported cumulative attack rate of 18% within five months (MSPP Surveillance, unpublished data). During March 22–April 6, 2011, we conducted a large seroepidemiologic survey in the commune, and found that 39% of study participants had vibriocidal titers ≥ 320 and nearly two-thirds had vibriocidal titers ≥ 80, suggesting that V. cholerae infection was widespread. Of those with vibriocidal titers ≥ 320, 9% met the criteria for severe cholera and an additional 17% had moderate or mild diarrhea. Although the strain responsible for the outbreak was biotype El Tor, this proportion of severe disease is substantially higher than previous estimates (2%) for typical V. cholerae biotype El Tor and is closer to estimates for classical biotype infections (severe disease in 11%).5,7 However, previous estimates were derived primarily from areas with endemic cholera, and the heightened severity observed in this study is likely explained, at least in part, by participants' lack of pre-existing immunity to toxigenic V. cholerae.
High rates of severe disease from El Tor V. cholerae infection during epidemics among cholera-naive populations have been observed. During a 1994 outbreak of El Tor cholera among Rwandan refugees in the former Zaire, an estimated 6–10% of refugees died within the first month; most deaths were attributed to diarrheal illness.30 The rate of severe cholera in that population was likely high, although other factors, including a concomitant shigellosis outbreak, a high rate of acute malnutrition, and a severe drinking water shortage, likely contributed.30,31
In addition to immunologic status, several factors may have contributed to the increased severity seen in our study compared with previous El Tor estimates, including the introduction of an El Tor strain that produces a CT similar to that of the classical biotype. The explosiveness of the epidemic2,25 is also compatible with exposure to a high inoculum of V. cholerae with a temporary increase in its infectivity because of rapid passage of the organism through many hosts.32 The high seroprevalence in our study, and the relatively high proportion of persons with severe disease, suggests that exposure was widespread and potentially at high levels. Future cholera response efforts should consider the high degree of severity observed when projecting resource needs.
Individual risk factors also influence the spectrum of illness from V. cholerae infection. Blood group O is not a likely explanation for the high observed proportion of severe disease. Group O, compared with other ABO blood groups, was not a risk factor for hospitalization in this study. Furthermore, prevalence of blood group O in our sample (45%) is not substantially greater than that in cholera-endemic areas such as Bangladesh13 and is substantially lower than that in many Latin American countries affected by cholera in the early 1990s (> 90%).14,16
Low gastric acidity and antacid use are previously identified risk factors for symptomatic cholera.33 Although we did not measure gastric acidity directly, 16% of participants reported using antacids since the start of the cholera epidemic, and seropositive participants who used antacids were more likely to have met the criteria for severe disease than seropositive participants who did not report antacid use. No data were collected on the frequency or duration of antacid use, and the possibility exists that some participants took antacids after developing cholera rather than before, but the strength of the association suggests that further study of antacid use during cholera outbreaks is warranted and that unnecessary antacid use should be discouraged.
Three markers of higher socioeconomic status (mobile phone, radio, and electricity in the household), were associated with milder illness severity among seropositive participants, although other measures (literacy and speaking French) were not. A difference in severity among socioeconomic groups could have been caused by differences in V. cholerae dosage as a result of better household hygiene or better access to safe water and sanitation. No differences in illness severity were observed by primary source of drinking water or use of water treatment. However, based on observations within the commune, alternate water sources were likely common and water treatment was intermittent based on availability of treatment supplies. Nutritional differences might also have contributed to the difference between socioeconomic groups. Micronutrient retinol, zinc, and iron deficiencies, likely more common among people of lower socioeconomic status, have been associated with more severe illness,12,19,34 whereas studies conflict on whether chronic macronutrient deficiency influences diarrhea severity among those infected with V. cholerae.35,36
Cholera was not observed in Haiti before 2010,2 and paired serum specimens were not available. Therefore, we measured threshold cutoffs for single serum specimens. Serologic testing has limitations and interpretations of results must be carefully considered. Because the study was conducted several months after the start of the outbreak, it is likely that some participants' antibody titers waned before serum collection. Considering that test validations must be conducted with serum from confirmed cases, we explored the outcome of seropositivity rates at lower, less specific cutoff titers of 80 and 160. The distribution of illness severity was similar among participants with vibriocidal titers ≥ 320, ≥ 160, ≥ 80, and among those with a positive anti-CT test result or a vibriocidal titer ≥ 320, suggesting that these illness severity estimates were robust across a range of antibody titers.
Detailed clinical records were not available to assess illness severity and we thus relied on self-report, which is subject to recall bias. However, two lines of evidence suggest that self-report was a reliable indicator of illness and treatment intensity. First, the epidemic curve created from participant reports of diarrhea onset (Figure 2A) is similar to reported national cholera surveillance data from Grande Saline Commune at the time of the survey (Figure 2B). Second, the proportion of participants reporting a cholera diagnosis (18%) was the same as the cumulative cholera incidence (18%) from national surveillance data for Grande Saline (MSPP Surveillance, unpublished data). Similar to previous studies, we used level of treatment received to classify disease severity.5,6 Although number of stools in 24 hours might be difficult to recall, participants and their families would likely remember a health facility visit, overnight stay, or IV fluid administration during the midst of an epidemic.
The study's sampling method was not completely random and a response rate could not be calculated, which might limit the generalizability of this study to the entire commune. However, several factors mitigate this problem. More than 10% of the commune was sampled and sampling was well-distributed among the commune's 13 villages. Also, the community was generally willing to participate, which was helped by involvement of local community health workers and the health center. Although adult men were undersampled, no differences were seen between the sexes for cholera diagnoses or seropositivity either before or after adjustment for age. Importantly, proportions of severe, moderate, and mild illness were calculated among seropositive participants, rather than among the entire sample, and are thus less susceptible to selection bias.
In summary, severe cholera developed in 9% of seropositive participants, moderate or mild diarrhea developed in 17%, and approximately 75% were asymptomatic. Nearly half of participants (45%) had positive vibriocidal or anti-CT IgA test results, both of which are associated with protective immunity.21,24 According to national surveillance data, in the two years since the study, the cumulative cholera attack rate increased from 18% to 24%, a relatively small increase compared with the rate of infection in the commune during the first five months of the epidemic (MSPP Surveillance, unpublished data). These findings suggest that a large proportion of Grande Saline commune residents developed protective immunity within several months of the beginning of the epidemic. The commune's high attack rate in the first few months of the epidemic also highlights the critical lack of access to safe water and hygiene, particularly residents' reliance on the river and canals for drinking water.
ACKNOWLEDGMENTS
We thank the citizens of Grande Saline Commune for their participation in the study; Brian Wheeler of CDC Haiti, the Hôpital Albert Schweitzer, Haiti, and the staffs of the Artibonite Department Health Office and the Drouin Health Center for their support; Ciara O'Reilly, Barbara Mahon, and Sharon Roy for providing guidance in the design of the study; John Copeland and Tracy Ayers for providing statistical advice; Michael Wellman (Geospatial Research, Analysis, and Services Program) for providing assistance with geographic information systems; and Nickolson Barthelemy for providing data.
- 1.↑
Jenson D, Szabo V, 2011. Cholera in Haiti and other Caribbean regions, 19th century. Emerg Infect Dis 17: 2130–2135.
- 2.↑
Barzilay EJ, Schaad N, Magloire R, Mung KS, Boncy J, Dahourou GA, Mintz ED, Steenland MW, Vertefeuille JF, Tappero JW, 2013. Cholera surveillance during the Haiti epidemic: the first 2 years. N Engl J Med 368: 599–609.
- 3.↑
Ministère de la Santé Publique et de la Population, 2013. MSPP Daily Reports on the Cholera Epidemic in Haiti [Rapports Journaliers du MSPP sur l'Évolution du Choléra en Haiti]. Available at: http://www.mspp.gouv.ht/site/index.php?option=com_content&view=article&id=120&Itemid=1. Accessed April 8, 2013.
- 4.↑
Swerdlow DL, Ries AA, 1992. Cholera in the Americas: guidelines for the clinician. JAMA 267: 1495–1499.
- 5.↑
Bart KJ, Huq Z, Khan M, Mosley WH, 1970. Seroepidemiologic studies during a simultaneous epidemic of infection with El Tor Ogawa and classical Inaba Vibrio cholerae. J Infect Dis 121 (Suppl): S17–S24.
- 6.↑
Woodward WE, Mosley WH, McCormack WM, 1970. The spectrum of cholera in rural East Pakistan. I. Correlation of bacteriologic and serologic results. J Infect Dis 121 (Suppl): S10–S16.
- 7.↑
Gangarosa EJ, Mosley WH, 1974. Epidemiology and surveillance of cholera. Barua D, Burrows W, eds. Cholera. Philadelphia, PA: WB Saunders Co, 381–403.
- 8.↑
Safa A, Nair GB, Kong RY, 2010. Evolution of new variants of Vibrio cholerae O1. Trends Microbiol 18: 46–54.
- 9.↑
Talkington D, Bopp C, Tarr C, Parsons MB, Dahourou G, Freeman M, Joyce K, Turnsek M, Garrett N, Humphrys M, Gomez G, Stroika S, Boncy J, Ochieng B, Oundo J, Klena J, Smith A, Keddy K, Gerner-Smidt P, 2011. Characterization of toxigenic Vibrio cholerae from Haiti, 2010–2011. Emerg Infect Dis 17: 2122–2129.
- 10.↑
Ghosh-Banerjee J, Senoh M, Takahashi T, Hamabata T, Barman S, Koley H, Mukhopadhyay AK, Ramamurthy T, Chatterjee S, Asakura M, Yamasaki S, Nair GB, Takeda Y, 2010. Cholera toxin production by El Tor variant of Vibrio cholerae O1 as compared to prototype El Tor and classical biotypes. J Clin Microbiol 48: 4283–4286.
- 11.↑
Siddique AK, Nair GB, Alam M, Sack DA, Huq A, Nizam A, Longini IM Jr, Qadri F, Faruque SM, Colwell RR, Ahmed S, Iqbal A, Bhuiyan NA, Sack RB, 2010. El Tor cholera with severe disease: a new threat to Asia and beyond. Epidemiol Infect 138: 347–352.
- 12.↑
Harris JB, LaRocque RC, Chowdhury F, Khan AI, Logvinenko T, Faruque AS, Ryan ET, Qadri F, Calderwood SB, 2008. Susceptibility to Vibrio cholerae infection in a cohort of household contacts of patients with cholera in Bangladesh. PLoS Negl Trop Dis 2: e221.
- 13.↑
Glass RI, Holmgren J, Haley CE, Khan MR, Svennerholm AM, Stoll BJ, Belayet Hossain KM, Black RE, Yunus M, Barua D, 1985. Predisposition for cholera of individuals with O blood group: possible evolutionary significance. Am J Epidemiol 121: 791–796.
- 14.↑
Swerdlow DL, Mintz ED, Rodriguez M, Tejada E, Ocampo C, Espejo L, Barrett TJ, Petzelt J, Bean NH, Seminario L, Tauxe RV, 1994. Severe life-threatening cholera associated with blood group O in Peru: implications for the Latin American epidemic. J Infect Dis 170: 468–472.
- 15.↑
Harris JB, Khan AI, LaRocque RC, Dorer DJ, Chowdhury F, Faruque ASG, Sack DA, Ryan ET, Qadri F, Calderwood SB, 2005. Blood group, immunity, and risk of infection with Vibrio cholerae in an area of endemicity. Infect Immun 73: 7422–7427.
- 16.↑
Cserti CM, Dzik WH, 2007. The ABO blood group system and Plasmodium falciparum malaria. Blood 110: 2250–2258.
- 17.↑
Nalin DR, Levine RJ, Levine MM, Hoover D, Bergquist E, McLaughlin J, Libonati J, Alam J, Hornick RB, 1978. Cholera, non-vibrio cholera, and stomach acid. Lancet 312: 856–859.
- 18.↑
Van Loon FPL, Clemens JD, Shahrier M, Sack DA, Stephensen CB, Khan MR, Rabbani GH, Rao MR, Banik AK, 1990. Low gastric acid as a rise factor for cholera transmission: application of a new non-invasive gastric acid field test. J Clin Epidemiol 43: 1361–1367.
- 19.↑
Alam AN, Goff PA, Abdal NM, Rashid MA, Rahaman MM, 1991. Serum ferritin and cholera: a prospective study. Trop Geogr Med 43: 12–16.
- 20.↑
Steinberg EB, Greene KD, Bopp CA, Cameron DN, Wells JG, Mintz ED, 2001. Cholera in the United States, 1995–2000: trends at the end of the twentieth century. J Infect Dis 184: 799–802.
- 21.↑
Glass RI, Svennerholm AM, Khan MR, Huda S, Huq MI, Holmgren J, 1985. Seroepidemiological studies of El Tor cholera in Bangladesh: association of serum antibody levels with protection. J Infect Dis 151: 236–242.
- 22.↑
Clements ML, Levine MM, Young CR, Black RE, Lim YL, Robins-Browne RM, Craig JP, 1982. Magnitude, kinetics, and duration of vibriocidal antibody responses in North Americans after ingestion of Vibrio cholerae. J Infect Dis 145: 465–473.
- 23.↑
Levine MM, Young CR, Hughes TP, O'Donnell S, Black RE, Clements ML, Robins-Browne R, Lim YL, 1981. Duration of serum antitoxin response following Vibrio cholerae infection in North Americans: relevance for seroepidemiology. Am J Epidemiol 114: 348–354.
- 24.↑
Harris AM, Bhuiyan MS, Chowdhury F, Khan AI, Hossain A, Kendall EA, Rahman A, LaRocque RC, Wrammert J, Ryan ET, Qadri F, Calderwood SB, Harris JB, 2009. Antigen specific memory B-cell responses to Vibrio cholerae O1 infection in Bangladesh. Infect Immun 77: 3850–3856.
- 25.↑
Piarroux R, Barrais R, Faucher B, Haus R, Piarroux M, Gaudart J, Magloire R, Raoult D, 2011. Understanding the cholera epidemic, Haiti. Emerg Infect Dis 17: 1161–1168.
- 26.↑
Institut Haitien de Statistique et d'Informatique, 2009. Estimate of Total Population and 18 Years and Older for the Year 2009 [Estimation pour l'Année 2009 des Populations Totale et de 18 Ans et Plus]. Available at: http://www.ihsi.ht/pdf/projection/POPTOTAL&MENAGDENS_ESTIM2009.pdf. Accessed April 8, 2013.
- 27.↑
Reimer AR, Van Domselaar G, Stroika S, Walker M, Kent H, Tarr C, Talkington D, Rowe L, Olsen-Rasmussen M, Frace M, Sammons S, Dahourou GA, Boncy J, Smith AM, Mabon P, Petkau A, Graham M, Gilmour MW, Gerner-Smidt P, 2011. Comparative genomics of Vibrio cholerae from Haiti, Asia, and Africa. Emerg Infect Dis 17: 2113–2121.
- 28.↑
Centers for Disease Control and Prevention, 2012. Notes from the field: identification of Vibrio cholerae serogroup O1, serotype Inaba, biotype El Tor strain–Haiti. MMWR Morb Mortal Wkly Rep 61: 309.
- 29.↑
Reimer CB, Phillips DJ, Aloisio CH, Moore DD, Galland GG, Wells TW, Black CM, McDougal JS, 1984. Evaluation of thirty-one mouse monoclonal antibodies to human IgG epitopes. Hybridoma 3: 263–275.
- 30.↑
Goma Epidemiology Group, 1995. Public health impact of Rwandan refugee crisis: what happened in Goma, Zaire, in July 1994. Lancet 345: 339–344.
- 32.↑
Hartley DM, Morris JG Jr, Smith DL, 2006. Hyperinfectivity: a critical element in the ability of V. cholerae to cause epidemics? PLoS Med 3: e7.
- 34.↑
Roy SK, Hossain MJ, Khatun W, Chakraborty B, Chowdhury S, Begum A, Mah-e-Muneer S, Shafique S, Khanam M, Chowdhury R, 2008. Zinc supplementation in children with cholera in Bangladesh: randomised controlled trial. BMJ 336: 266–268.
- 35.↑
Glass RI, Svennerholm AM, Stoll BJ, Khan MR, Huda S, Huq MI, Holmgren J, 1989. Effects of undernutrition on infection with Vibrio cholerae O1 and on response to oral cholera vaccine. Pediatr Infect Dis J 8: 105–109.
- 36.↑
Palmer DL, Koster FT, Alam AKMJ, Islam MR, 1976. Nutritional status: a determinant of severity of diarrhea in patients with cholera. J Infect Dis 134: 8–14.